Project Overview
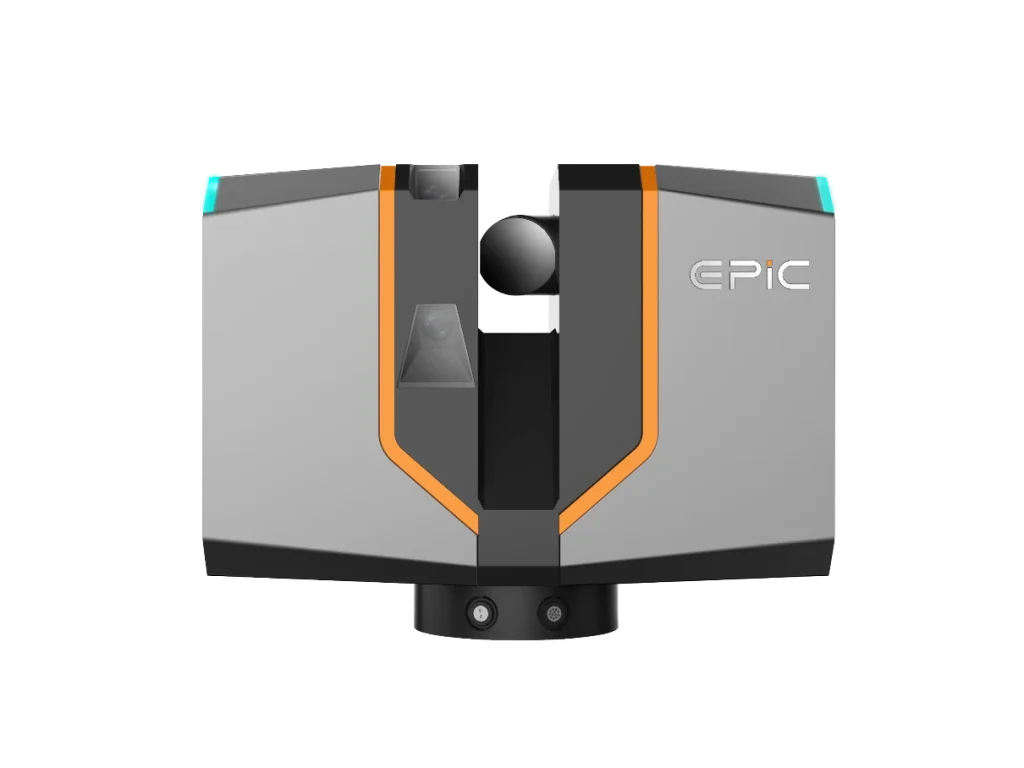
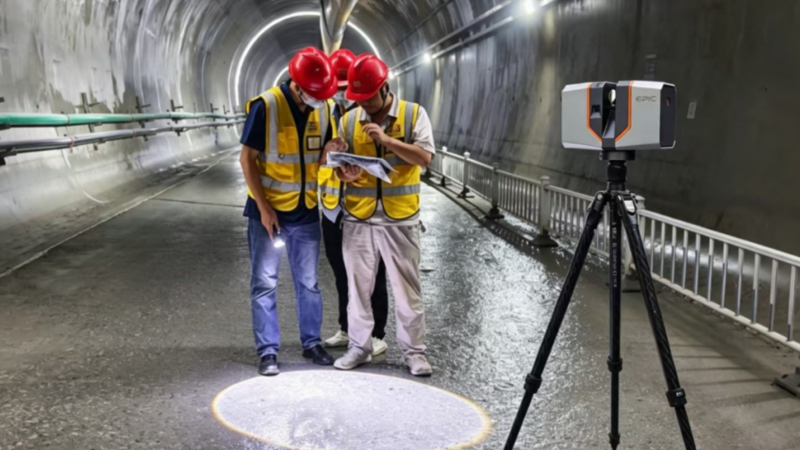
A tunnel project used the Xiangyin T150 and Z3D Tunnel Point Cloud Analysis System for full-section scanning and quality analysis. The team captured 117 m of tunnel from six scan stations, registered the point clouds in the project coordinate system, and performed overbreak/underbreak and clearance analysis.
| 117 m
Tunnel length scanned |
19 min
Six field scan stations |
6 mm
Mean check-point error |
96.9%
Point errors below 1 cm |
01 Project Background
Tunnel quality control requires reliable measurement data. In long, confined and poorly lit tunnel environments, conventional methods are limited: point-by-point or discrete cross-section surveys are slow, typical accuracy is at the centimeter level, and sampled measurements cannot fully represent the tunnel lining surface.
02 Key Challenges
- Incomplete coverage: Sampled, point-based surveys can miss local defects and areas of overbreak or underbreak.
- Low field efficiency: Point-by-point and discrete cross-section surveys progress slowly and make long, full-section inspections time-consuming.
- Accuracy-efficiency trade-off: High-accuracy static scanning often requires extensive post-processing, while portable systems may not provide sufficient accuracy or stability in tunnels.
- Limited on-site availability: Conventional registration relies on common features and manual post-processing, delaying point clouds in the project coordinate system and subsequent analysis.
03 Solution: T150 + Z3D Tunnel Point Cloud Analysis System
The solution combines the Xiangyin T150 3D laser scanner, a total station, a custom prism adapter, a survey-pole bipod and a tablet running Z3D control software. Scan data and prism coordinates measured by the total station are captured together. The Z3D Tunnel Point Cloud Analysis System performs on-site registration, transformation to the project coordinate system, quality analysis and deliverable generation. Hereafter, it is referred to as Z3D.
Key T150 Specifications
| Parameter | Value |
| Ranging method | Pulsed |
| Laser wavelength | 1550 nm |
| Scanner weight | 3.2 kg |
| Angular accuracy | 0.001° |
| Scanning field of view | 300° vertical, 360° horizontal |
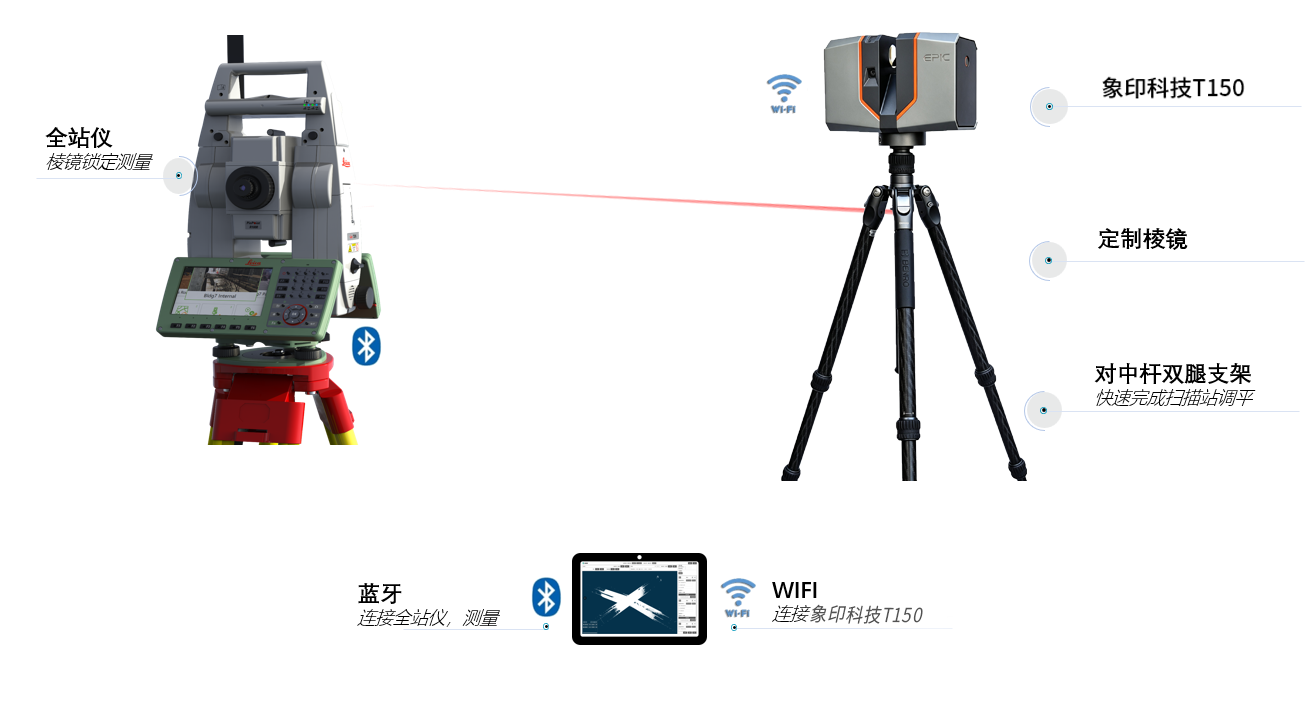
Figure 1. Solution architecture: T150, total station, custom prism and tablet
Solution Benefits
| Capability | Project value |
| Dense full-section capture | Captures high-density point clouds of the tunnel surface and reduces gaps associated with sampled surveys. |
| Millimeter-level project coordinates | Captures scan data with station coordinates and achieves millimeter-level registration errors across scan stations. |
| Closed on-site workflow | Completes scanning, point cloud registration, transformation to the project coordinate system and quality analysis on site, supporting immediate construction decisions while reducing delays and rework. |
| Lightweight operation | The 3.2 kg T150 can be carried and set up by one operator. |
04 Field Workflow
| 01 | Establish survey control
Set up the total station on a known tunnel control point to establish the project coordinate reference. Verify the total station Bluetooth link, T150 Wi-Fi connection and tablet control link. |
| 02 | Capture scans and station coordinates
Set up and level the T150. Use the tablet to control scanning and acquire station coordinates with the total station. Review N/E/H coordinates and point cloud data in real time. |
| 03 | Capture multiple stations and register on site
Move the scanner to the next station and repeat the capture. After all stations are complete, register the point clouds on the tablet, review registration accuracy and convergence, and generate point clouds in the project coordinate system. |
| 04 | Run quality analysis and generate deliverables
Import the project-coordinate point cloud into Z3D for overbreak/underbreak, clearance, cross-section, volume, surface evenness and lining thickness analysis. Generate color maps, quantitative reports and 3D models. |
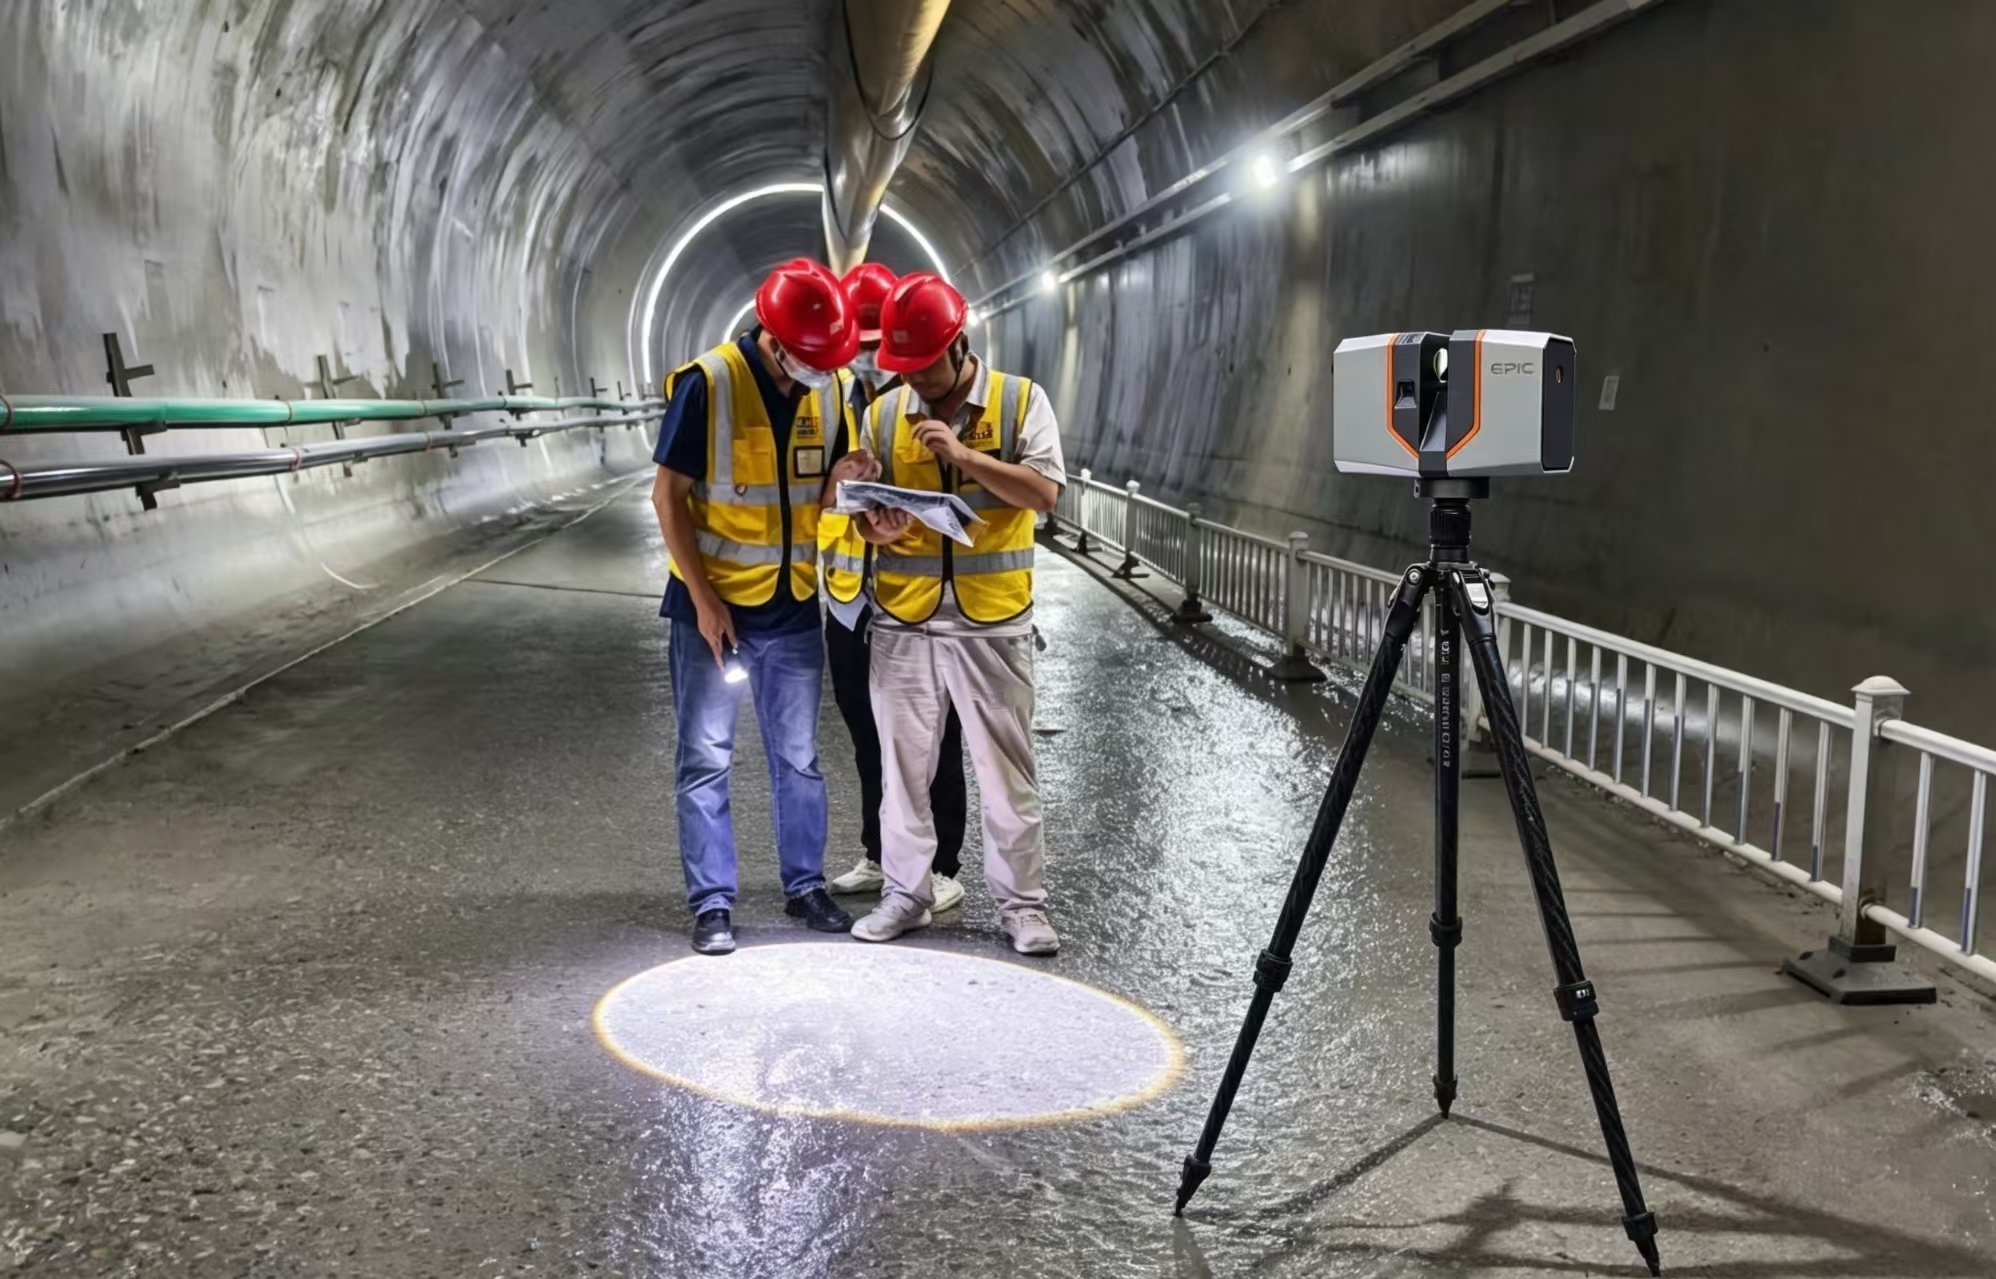
Figure 2. Field setup and data capture
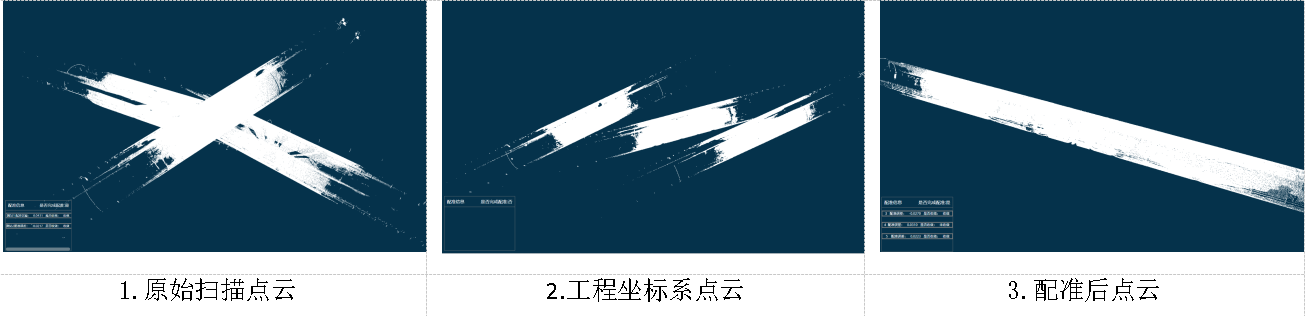
Figure 3. Raw scan data, point clouds in the project coordinate system and registered point clouds
05 Measured Results
Point Cloud Deliverables
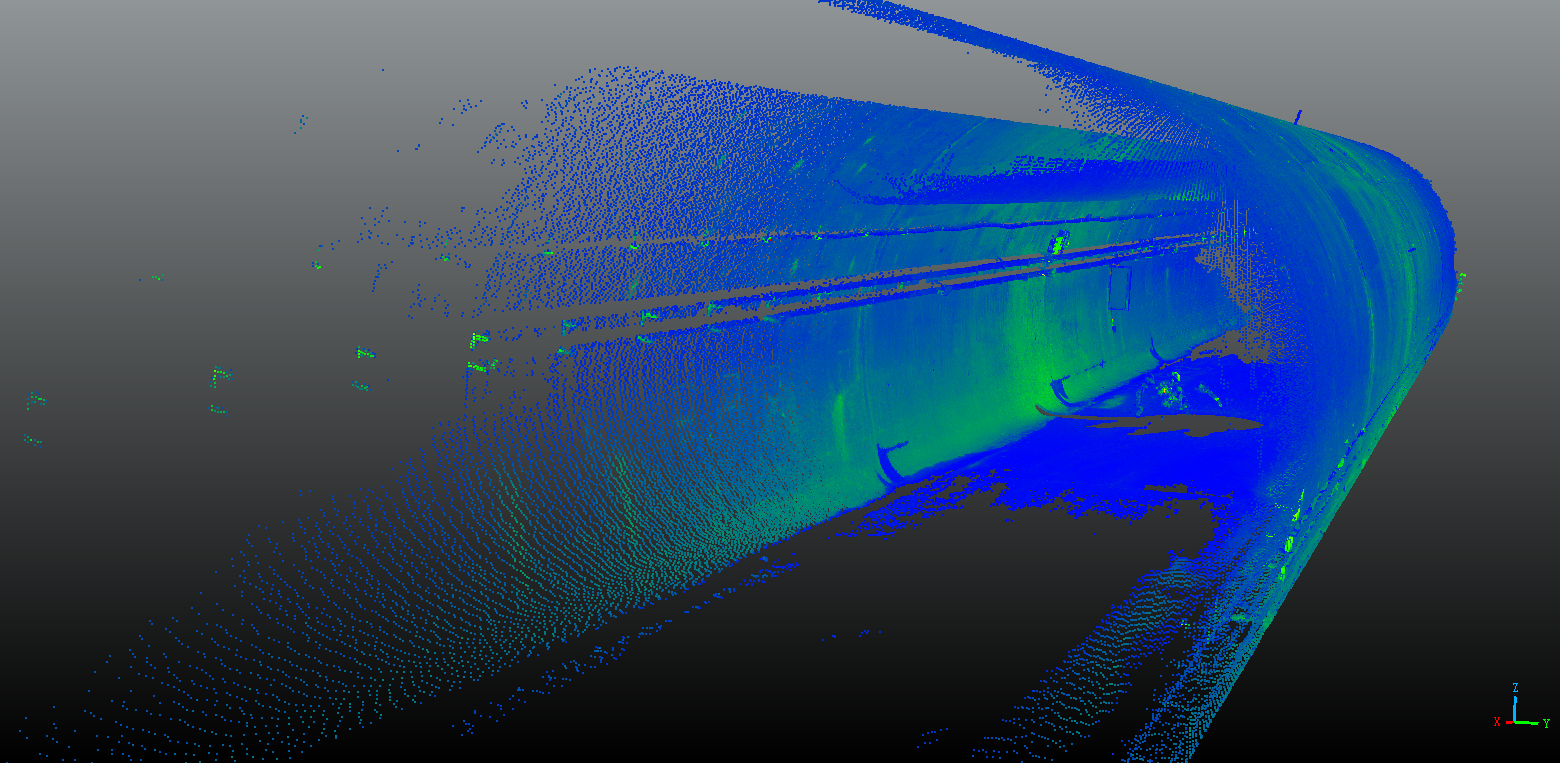
Figure 4. Full-section tunnel point cloud
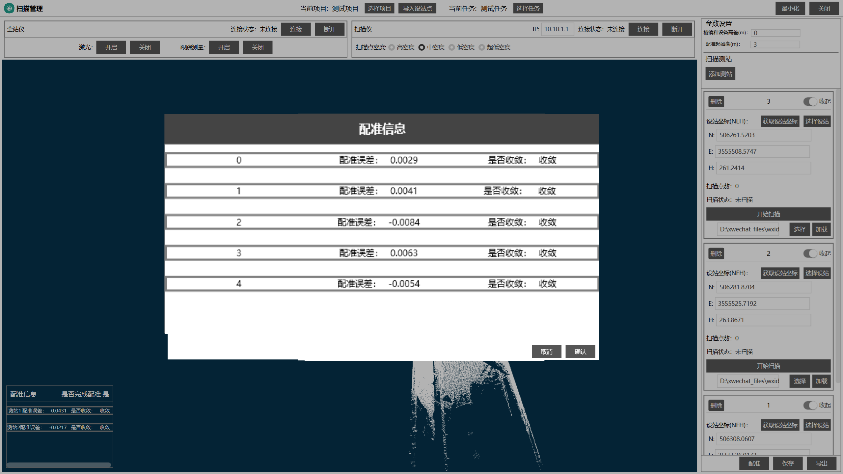
Figure 5. On-site point cloud registration
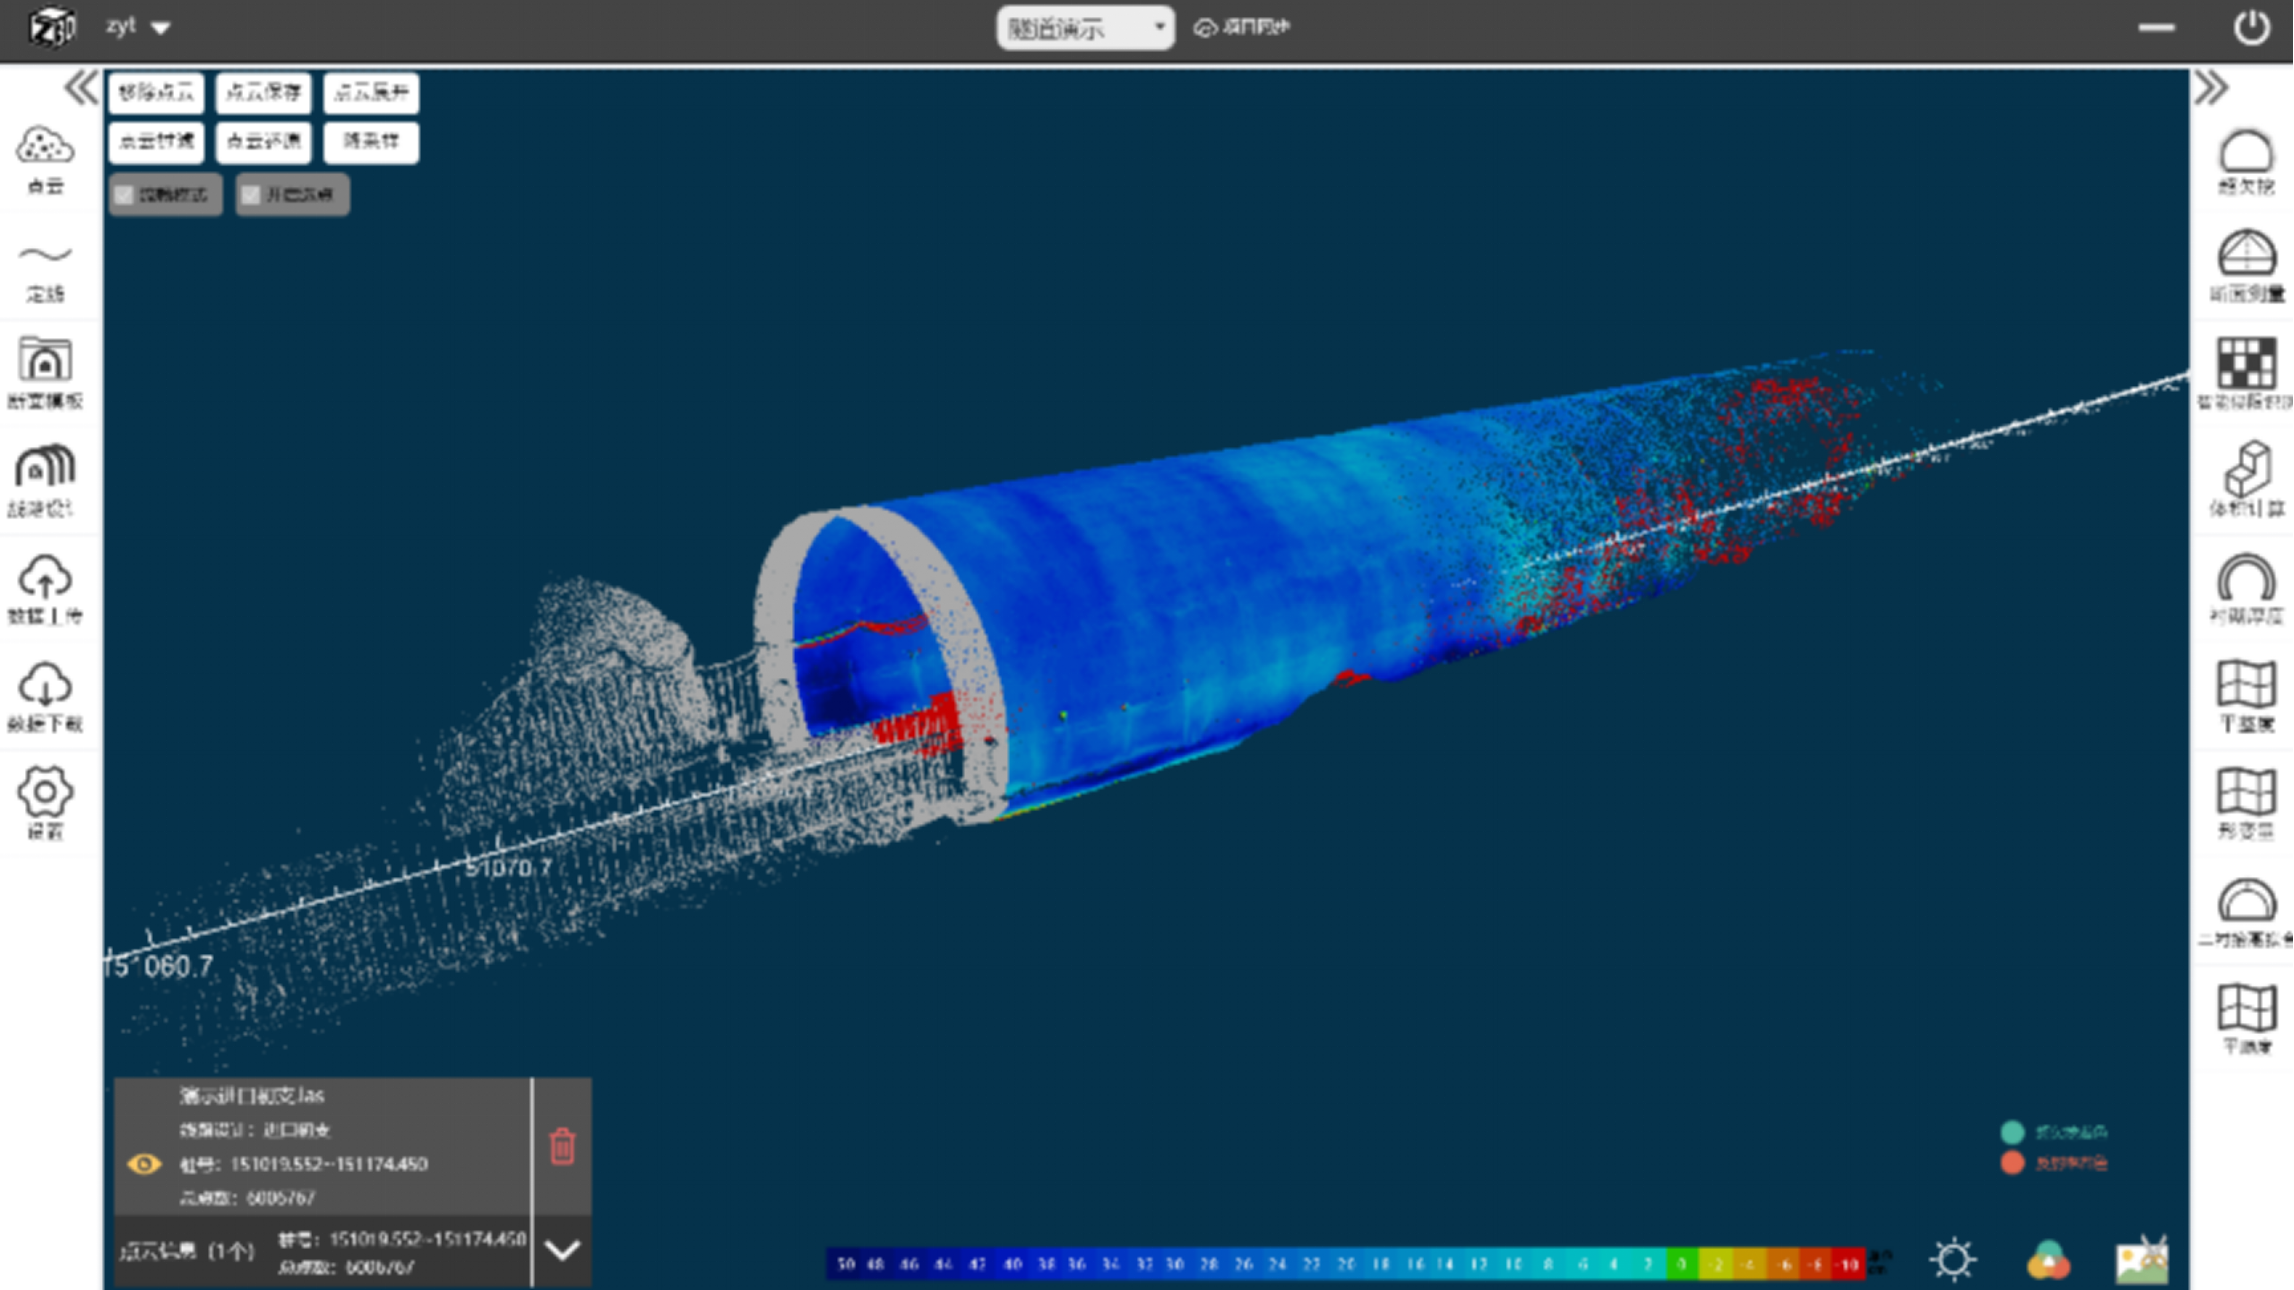
Figure 6. Tunnel quality analysis
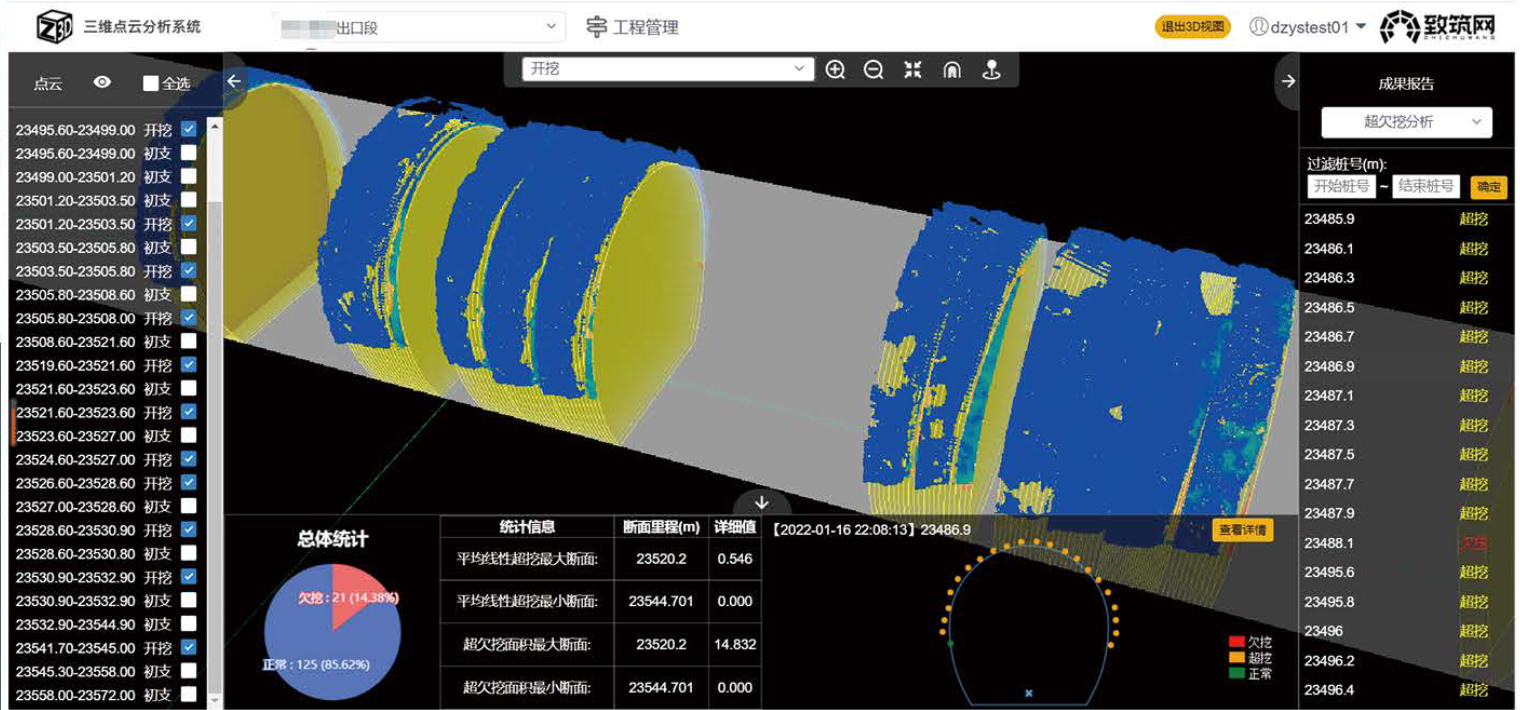
Figure 7. Z3D overbreak/underbreak analysis and reporting interface
06 Project Summary
Using the Xiangyin T150 and Z3D Tunnel Point Cloud Analysis System, the team completed full-section scanning and quality analysis for a tunnel project. Field capture covered 117 m from six scan stations in 19 minutes. Office analysis and deliverable generation took less than 10 minutes.
The mean check-point error was 6 mm, and 96.9% of point errors were below 1 cm. Registration and scanning accuracy met the requirements for key tunnel construction checks, including overbreak/underbreak and clearance analysis.
| Metric | Result | Details |
| Scan time per station | 60 sec/station | Time for one T150 scan station |
| Field advance rate | 20 m/min | No targets required; move immediately after each scan |
| Measured field performance | 117 m / 19 min | Field capture from six scan stations |
| Analysis and deliverables | Less than 10 min | Registration, quality analysis and deliverable generation |
| Mean error | 6 mm | Measured check-point result |
| Errors below 1 cm | 96.9% | Point errors below 1 cm |
| Overall efficiency gain | More than 10x | Compared with conventional single-point tunnel profiling |